Debugging DMS
Thanks to Symbol files and Source Link, we’re able to debug the DMS framework from within our application, without having to donwload the source code locally.
To be able to Step Into the code, we should configure Visual Studio to:
Download the symbol files from nuget if available.
Enable the source link to redirect the pdb information to the source code hosted on Github.
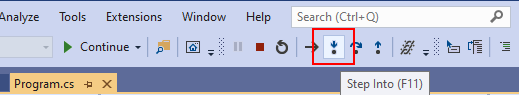
Once we’ve correctly configured our Visual Studio environment, we are able to Step Into the DMS code, during a debugging session (or press F11):
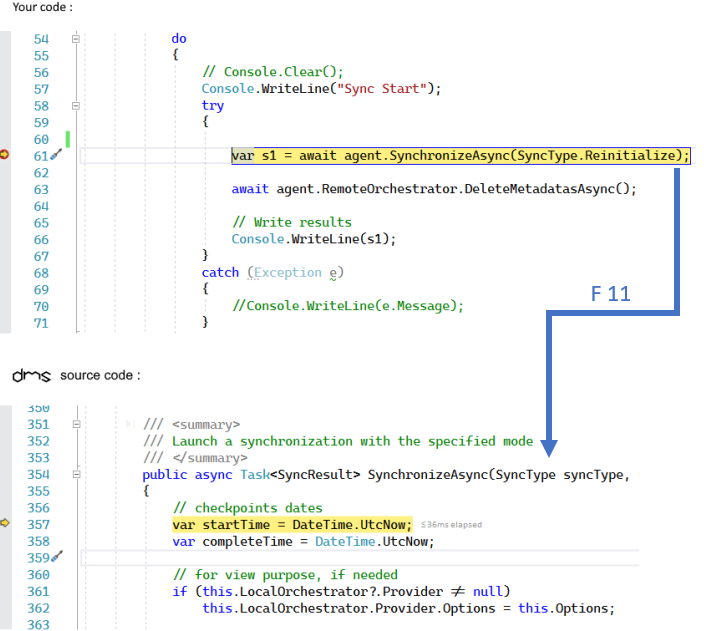
As you can see in the previous screenshot, we are actually step into the SynchronizeAsync method directly from your code.
Behinds the scene, the .pdb file retrieves the correct filename and position and the Source link download the correct file from the DMS Github repository .
Let’s see in details how to configure your Visual Studio environment:
Symbols packages
Symbol files (.pdb) are produced by the .NET compiler alongside assemblies. **Symbol files* map execution locations to the original source code so you can step through source code as it is running using a debugger.
DMS publishes the symbols packages, containing the .pdb files, for each release to the nuget symbols server.
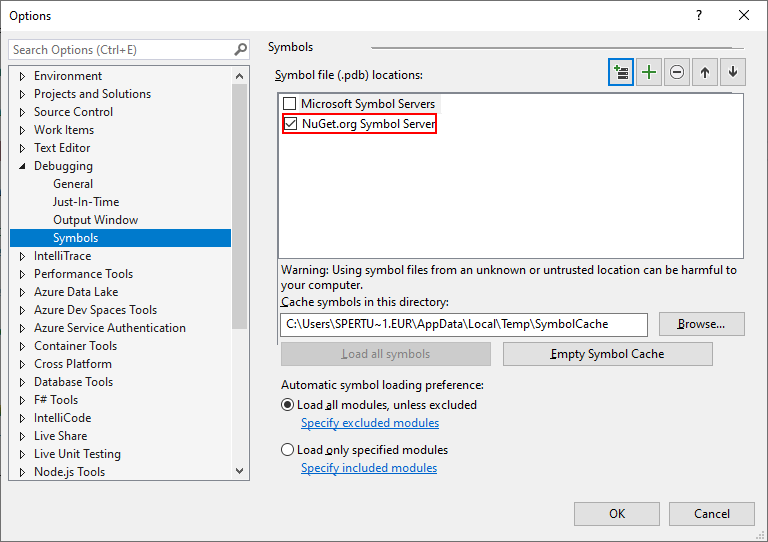
To be able to get the symbols, we should check we have Nuget as a symbol server availabe from our Visual Studio options:
Go to Tools > Options > Debugging > Symbols:
Verify we have Nuget.Org Symbol Servers checked.
Uncheck Microsoft Symbol Servers, unless we want also to debug the .NET Core assemblies from within our application.
Hint
If you don’t have the Nuget.Org Symbol option, you can add this url directly : https://symbols.nuget.org/download/symbols
Source link
Note
More information on source link technology: SourceLink
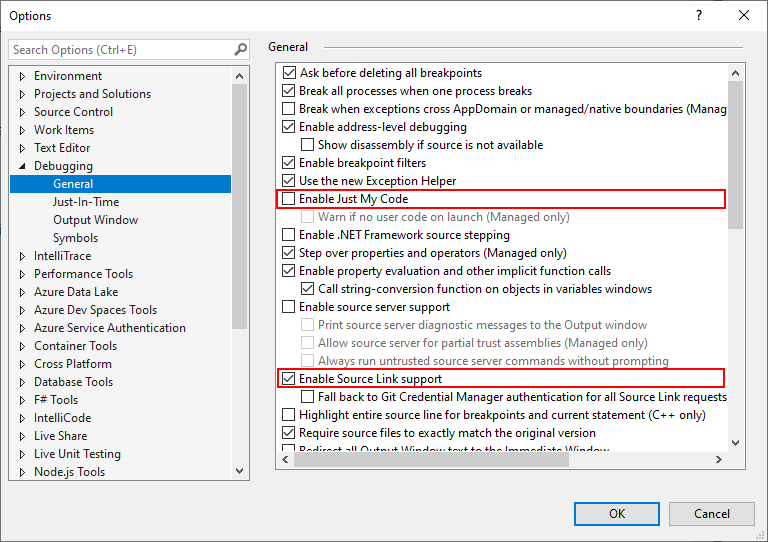
To be able to use the Source link technolgy, we should verify the option is checked from within our Visual Studio options:
Go to Tools > Options > Debugging > General:
Uncheck Enable Just My Code
Check Enable Source Link support
We can now debug our code, and Step Into the DMS code as well.
If you need more information, you can check this documentation: Using Pdb and Source code